

Fundamentally Speaking
Soybean Yields & Growth for Top Producers

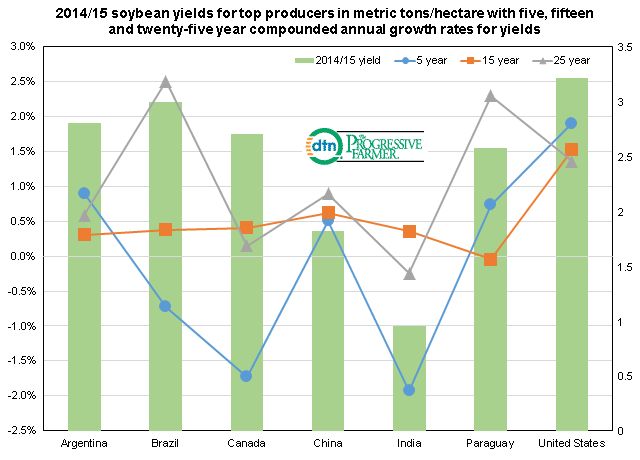
Concluding our series on how U.S. yields of major crops compare with those overseas, this graphic shows soybean yields for some of the world's major producers.
Similar to what we did with wheat and corn, soybean yields this past year for seven of the top producing countries are reported in metric tons per hectare (MT/ha).
The five, fifteen and twenty-five year compounded annual growth rates (CAGR) for each time period are also plotted.
The U.S. had the highest soybean yield of any country last year at 3.21 metric tons per hectare as they did the prior year though over the past number of years Canada or Brazil will often have the highest yields.
What is interesting though is the U.S. has seen the highest CAGR for the past five and fifteen years at 1.9% and 1.5% respectively with Brazil having the highest 25 year CAGR of 2.5%.
Some of the reasons for this may be the improved seed technology and less yield drag on soybeans that are planted outside the traditional "core" Midwest region.
As soybean prices have risen dramatically over the past number of years linked to very robust Chinese demand, plantings in the U.S. have expanded in the Southeast, Delta and Plains states, displacing other crops that used to be sown in those regions and yields in these areas have held in very well.
We suspect that this is not the case overseas especially in South America as new land is cleared for oilseed plantings.
(KA)
P[L1] D[0x0] M[300x250] OOP[F] ADUNIT[] T[]
Comments
To comment, please Log In or Join our Community .