

Fundamentally Speaking
July Wheat-Corn Spread & History

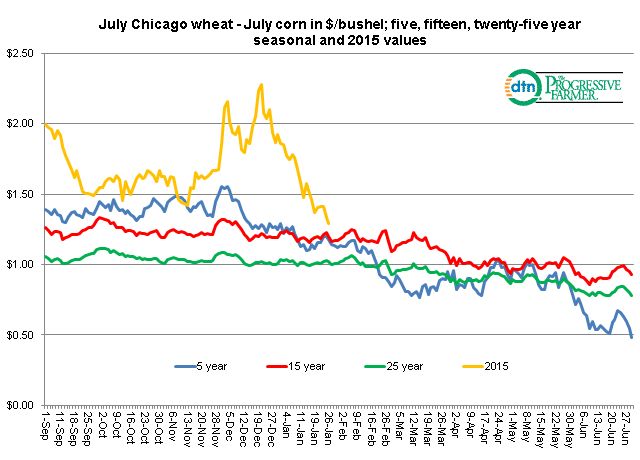
Since peaking out at $2.28 on December 18, the 2015 July Chicago wheat -- July corn spread has dropped like a rock falling to a recent low of $1.29 premium wheat, a dollar's worth of decline in about five weeks.
Most of this is due to wheat which has tumbled by $1.25 per bushel over that timespan vs. a 29 cent decline for corn.
Looking at the seasonal charts of the July wheat-corn spread it appears that further erosion of July wheat prices relative to July corn will occur.
P[L1] D[0x0] M[300x250] OOP[F] ADUNIT[] T[]
This graphic shows this spread using 1990-2014 data for the five, fifteen and twenty-five year seasonal and what has occurred so far for the 2015 spread; all in dollars per bushel.
This year's peak came about three weeks later than normal with the 5, 15 and 25 year seasonal all showing the seasonal high occurring between November 30 and December 4th.
The spread tends to narrow from that point and even in late January the path of least resistance is lower.
From January 26th the five year seasonal shows the spread contracting by another 59% with the 15 and 25 year seasonal showing another 23% narrowing by the end of June.
If this year's spread replicated the five year seasonal from this date then by the end of June then July Chicago wheat would have a $0.53 per bushel premium over July corn while the 15 and 25 year seasonal would project to a $1.00 spread.
Fundamentally wheat usually declines in the spring assuming weather cooperates while the seasonal for corn is positive at least through the first week of May.
(KA)
Comments
To comment, please Log In or Join our Community .