

Fundamentally Speaking
Seasonal July-November Soybean Spread
Despite the USDA cutting 2014-15 U.S. soybean stocks by 40 million bushels in its' latest WASDE report, the stocks to use ratio still came in at 11.2%.
This is the highest U.S. soybean stocks to use ratio issued in the December WASDE report since an 18.3% ratio was posted in December 2006 and well above the average 4.8% ratio seen over the past three years.
This is a much more comfortable ending stocks situation and may explain why close to the first of the year the July-November 2015 price spread is a mere 38 cents premium to the July contract vs. the 72 cent premium average seen over the past three years.
P[L1] D[0x0] M[300x250] OOP[F] ADUNIT[] T[]
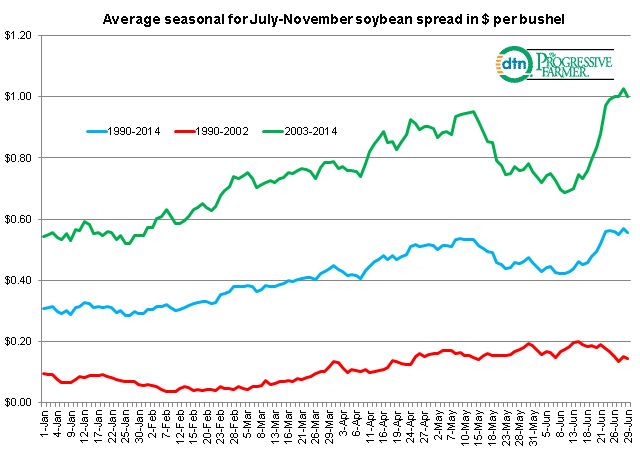
This graphic shows the July-November soybean spread in dollars per bushel from January 1 to June 30 for three separate time periods; 1990-2014, 1990-2002 and 2003 to 2014.
For all three time periods, the spread tightens or old crop July tends to gain in new crop November though that movement is more pronounced using the more recent as opposed to past history.
For instance for the whole time period of 1990 to 2014 between January 1 and June 30 July increases on average 25 cents relative to the November contract but that move is only 5 cents for the 1990-2002 period yet jumps to a 46 cent move using the 2003-2014 data.
The lows for the spread tend to be seen in the winter including the first week in January for the 1990-2014 period, the first week of February for the 1990-2002 period and the last week of January for the 2003-2014 range.
On the other hand the greatest premium between the July and November contracts is toward the end of June, right before the July contract goes into its' delivery period.
Given this situation it would appear that the 38 cent premium that July 2015 soybean futures have over the November 2015 futures should actually increase next year.
Certainly one of the main reasons why the July soybean futures hold such a premium over the November contract in the more recent (2003-2014) period over the more distant (1990-2002) period is that the final soybean stocks to use ratio averaged 10.5% from 1990 to 2002 falling to a 7.4% ratio from 2003 to 2014 with the 2013/14 ratio of 2.6% the tightest ever.
(KA)
© Copyright 2014 DTN/The Progressive Farmer. All rights reserved.

Comments
To comment, please Log In or Join our Community .