

Fundamentally Speaking
2012, 2013 Soybean Yields
As opposed to corn, the USDA did increase the 2013 U.S. soybean yield in the final production report of the year, up 0.3 bushels per acre (bpa) from November’s 43.0 bpa estimate.
Given the cold wet spring that delayed seedings and kept some intended ground from being seeded and the very dry conditions the second half of the growing season, this yield was not too bad.
P[L1] D[0x0] M[300x250] OOP[F] ADUNIT[] T[]
Actually, yields could have been lower were it not for some late half of September rains that greatly benefited the lagged crop and a very late first fall freeze that allowed the majority of the plants to reach full maturity.
Still, the national yield was below trend for the third consecutive year though not the degree seen in the massive drought year in 2012.
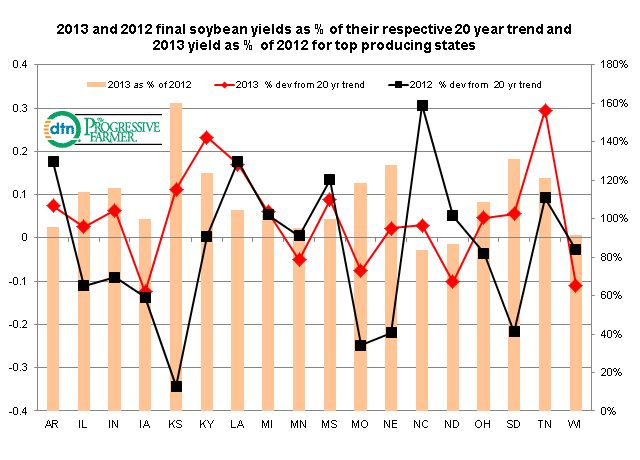
This graphic shows both the 2012 and 2013 final soybean yields percent deviation from their respective 20 year trend and the 2013 yield as a percent of the 2012 yield for the top 18 soybean producing states.
Whereas in 2012 when nine of the 18 states had yields below trend led by KS, down 34.3%, only five of the states had yields below trend. IA, MN, ND, and WI all had a number of weather setbacks including wet and cold conditions in the spring, dryness in the summer, and some very late maturing plants that were clipped when the first fall freeze did arrive.
MO also had below trend yields due to dryness that gripped much of the Western Corn Belt during the summer.
It should be no surprise then that only NC and ND had yields in 2013 below the year prior and while the former had above trend yields both years, the 2012 yield in North Carolina was 39.5 bpa, a whopping 30.7% above that year’s 20 year trend.
(KA)

Comments
To comment, please Log In or Join our Community .