

Fundamentally Speaking
Corn Stocks-to-Use, Price

The stocks-to-use ratio for corn used to be a very good indicator of average corn farm prices in years past.
High stocks-to-use ratios would normally result in lower prices and vice-versa.
The relation between stocks to use and prices have become less useful in recent years with the renewable fuels boom and recent short crops resulting in very slow stocks-to-use ratios and very high prices. In fact now prices trade a much higher levels given certain stocks-to-use ratios than was the case in the past (1970’s thru 1990’s).
P[L1] D[0x0] M[300x250] OOP[F] ADUNIT[] T[]
Part of the reason is that demand especially from the ethanol sector has become more inelastic where there is some demand even at extraordinarily high prices.
Furthermore, the need to increase U.S. corn acreage by 3-4 million bushels per year to accommodate the 500-700 million bushels worth of new demand by the renewable fuels industry kept prices higher than traditional price-stocks/use scatter studies would imply.
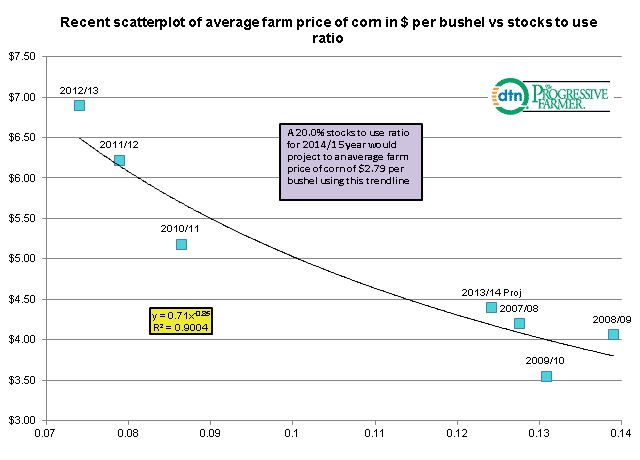
For that reason, we drew up an average farm price vs. stocks-to-use ratio scatterplot for recent years or since the big increase in ethanol production started and corn prices saw a paradigm shift to a higher trading range than had been the case prior to 2007.
The sample number is small, using only seven years including the 2013/14 projections contained in the January 2014 WASDE report.
We used a non-linear trendline to reflect the asymmetric response of corn prices to varying stocks-to-use levels.
A low ratio sends corn prices much higher than large stocks-to-use ratio will result in lower corn prices.
Note the equation explains over 90% of the corn price variability.
Plugging in the last USDA projection of 2013/14 U.S. corn ending stocks of 12.4% resulted in a calculated average farm price of $4.19 vs. the last USDA midpoint of the projected range at $4.40 per bushel.
Looking ahead to next year, large beginning stocks, a sizable 2014 crop based on 93-94 million acres and trend yields combined with just an average increase in demand could easily result in a stocks-to-use ratio near 20.0%.
That would project average farm prices next year at or close to $2.79 per bushel.
(KA)
Comments
To comment, please Log In or Join our Community .