

Fundamentally Speaking
Corn Yields in Top States

The USDA threw the corn market a wicked curve last Friday releasing some bullish numbers shortly after prices had made not only new contract lows but had moved to their lowest levels in over 40 months.
A lower than expected December 1 stocks figure prompted the USDA to hike feed demand by 100 million bushels and more surprisingly, actually lowered the 2013 U.S. corn yield and production.
With reports of stellar field results persisting until the end of harvest along with a historically late first fall freeze, expectations were widespread that the final yield would come in higher than Novembers’ projected 160.4 bushels per acre (bpa) that was 5.1 bpa better than September indication.
P[L1] D[0x0] M[300x250] OOP[F] ADUNIT[] T[]
This was not the case with a final yield of 158.8 bpa and production down 64 million bushels even with an increase in the harvested acreage number.
Still, this is much better than last year when the U.S. corn yield at 123.4 bpa was the lowest since 1995, 24.7% below trend.
This year’s figure clocks in at 1.1% above trend and is 129% of the year ago yield.
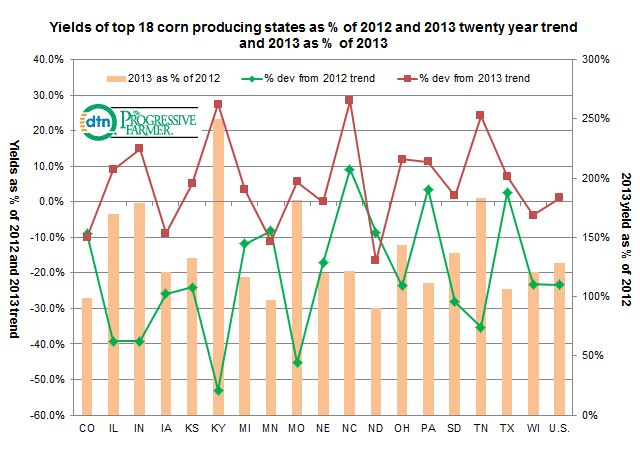
The accompanying graphic shows the percent that the U.S. and top 18 corn states 2012 and 2013 yields deviated from their respective 20 year trend.
Note that the 2012 trend uses the years 1992-2011 but the 2013 trend has a 1993-2012 range.
For most states, this means that for most states the 2013 trend yield is actually lower than the 2012 trend yield since the 2013 trend incorporates the disastrous 2012 results.
The biggest turnaround was KY where the record 2013 yield at 170 bpa is a stunning 102 bushels higher or 250% greater than last year when the yield was 53% below trend but this year is 27.5% better.
NC and TN also had the highest yields relative to trend this year as opposed to 2012 when NC again along with PA and TX were the best performers and the only states to have above trend yields.
This year the more northern states performed less favorably with CO, IA, MN, ND, and WI coming in below trend. Finally, along with KY, IL, IN, MO, and TN had yields 150% better than year ago levels.
(KA)
© Copyright 2014 DTN/The Progressive Farmer. All rights reserved.
Comments
To comment, please Log In or Join our Community .