

Fundamentally Speaking
Slowdown in Corn Trading, Volatility

Action in the corn market has slowly stopped, as countervailing bullish and bearish factors has resulted in range bound trade for most of October.
Price pressure on the downside has come from ideas that the next crop production report will show higher yields that will result in more bushels even with an anticipated cut in harvested acreage.
In addition to greater output, ending stocks for 2013-14 are seen higher based on the last quarterly stocks report showing supplies 128 million greater than anticipated and sentiment that projected demand for U.S. corn this year is overstated by the USDA.
On the other hand, cash corn supplies remain tight as farmers, completely dissatisfied with current offers are squirrelling away as much of the crop as possible utilizing the vast amount of storage space built over the past few years.
P[L1] D[0x0] M[300x250] OOP[F] ADUNIT[] T[]
The harvest itself is rather slow given the lateness of the crop and the willingness of producers to let the crop dry down in the fields as opposed to expending funds for artificial drying that has also limited the flow of supplies to the pipeline.
Strong nearby ethanol margins and foreign countries eager to procure U.S. corn at the cheapest levels in over three years have also been seen as supportive.
Adding to the market torpor has been the impact from the government shutdown with a crop report canceled for the first time in history and such key fundamental information as crop progress, export sales, and commitment of trader data being released piecemeal.
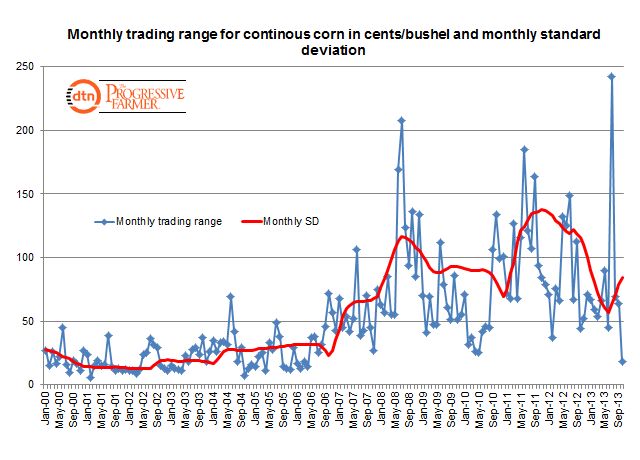
The net effect has been a marked reduction in both price movement and volatility.
This is reflected in the accompanying graphic showing the monthly range of spot corn futures in cents per bushel and the volatility expressed as the monthly standard deviation.
With four days left in October, December 2013 corn futures have traded as high as $4.49 ¾ with a low of $4.32, essentially an 18 cent trading range.
If this holds through the end of the month that would be the smallest monthly range for spot corn futures since April of 2006.
The monthly standard deviation fell to a level of 56.9 in June with the lack of any real weather scare and that was the lowest level for that indicator since March 2007.
We have noticed that all the major moving averages are starting to converge in a tight ball and that is often a precursor for a sharp price move in either direction.
Given that and the reduced volatility, the purchase of an option straddle may be propitious.
(KA)
Comments
To comment, please Log In or Join our Community .