Fundamentally Speaking
Forecasted Corn Prices Seen High
The USDA will issue its next crop production report on October 11 and at that time; they will update their world agricultural supply-demand estimates (WASDE).
In an earlier piece, we noted that is the USDA increased its U.S. corn yield estimate from the August to the September crop production report there was a strong likelihood that the USDA would again increase the yield from the September into the final report issued in January.
This along with the continuation of stellar harvest results with yields coming in anywhere from 5-30 bushels per acre (bpa) better than expectations strongly suggests an upward revision in the 2013 U.S. corn yield last estimated at 155.3 bpa.
P[L1] D[0x0] M[300x250] OOP[F] ADUNIT[] T[]
It will be interesting to see what the USDA does with demand for their 12.6/% forecasted increase in total consumption would be the fifth largest year-to-year rise since 1975 yet questions abound specifically over their feed/residual and export estimates.
The reason we bring this up is the last WASDE showed a 14.6% stocks to use ratio and an average farm price of $4.80 per bushel.
Even though this price is down $2.10 per bushel from the record set the prior year, it seems as if it should be lower given that the stocks to use ratio will be 250% higher than seen in the 2012/13 season.
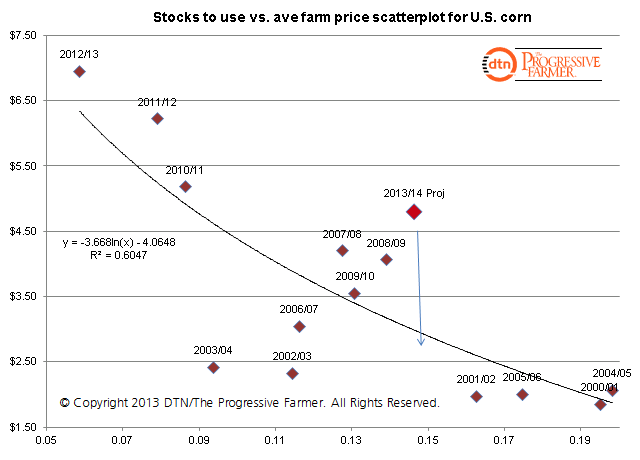
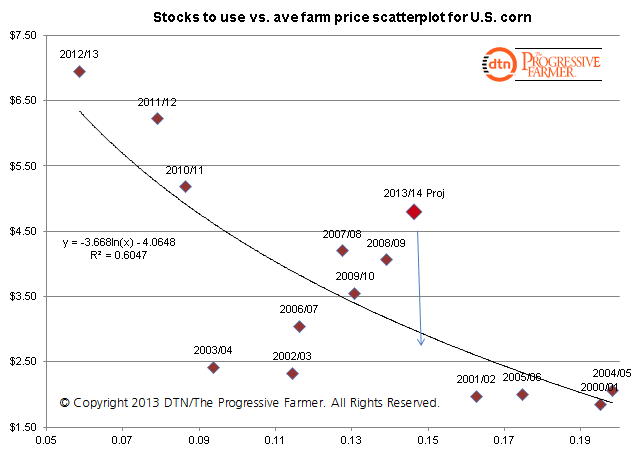
This graphic shows a scatter-plot of the stocks to use ratio vs. average farm price for years starting in 2000/01.
The R squared at 61% used to be higher but in recent years, it appears that corn prices are trading at higher levels than used to prevail given similar stocks to use ratios.
For instance from 2007-2010 the stocks to use ratio averaged 13.2% with an average farm price of $3.94.
We think that one of the reasons why prices have traded at higher levels than traditional scatter studies suggest is that during the big ethanol boom even if the market had adequate supplies it was always worried about next year.
Specifically it was whether production would be able to accommodate the additional 0.5-1.0 billion bushels worth of new corn demand that was occurring year in and year out.
Another consideration was U.S. prices were also incorporating more of the global situation with rising demand and a lower dollar leading to higher priced corn.
With the end of the big ethanol boom, record U.S. and global corn production, and ideas the corn balance sheet, both on world and domestic basis will feature more comfortable supplies going forward we wonder whether corn will start to trade lower, more in line with past history.
(KA)


Comments
To comment, please Log In or Join our Community .