

Fundamentally Speaking
Iowa August Rainfall, Soybean Yield Changes

Estimating the U.S. soybean yield in August is always tricky for in many years the crop is not that mature so there is a lot of guesswork involved in estimating the number of pods, especially if few pods are present, now many beans will be present in each pod and how much these beans weigh.
The situation is even more complicated this year as soybean plantings were record late in a number of key producing states so ascertaining yields this year was even more difficult.
As discussed in prior pieces, the lagged development of this crop is a two-edged sword for while increasing the chances of losses from a normal let alone early fall freeze in a number of Midwest states, it also gives the plant more chances to respond favorable to September rains should they emerge.
The reason this is important is that soybeans are a crop of August for that is when they go through the critical stage of development setting pods and then filling those pods with beans.
P[L1] D[0x0] M[300x250] OOP[F] ADUNIT[] T[]
August has been record dry in a number of states including Iowa where much of the state has received no measureable precipitation at all.
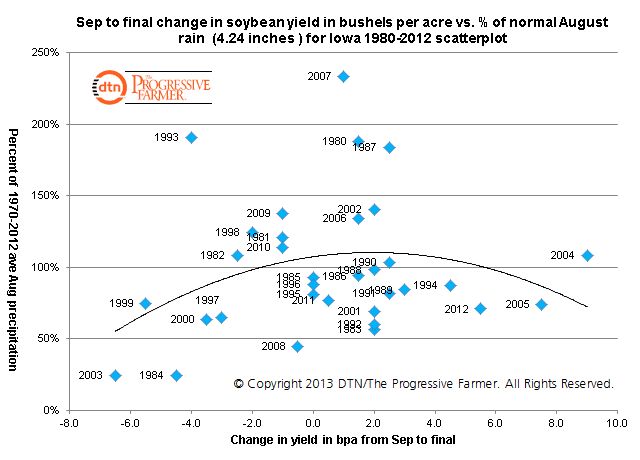
This chart looks at the change in Iowa’s soybean yield from the September to the final report issued in January in bushels per acre vs. the percent of normal Iowa rainfall in August with the 1970-2012 average being 4.24 inches.
Given the drought that has overtaken the state since mid-July, it seems almost a given that the USDA will lower the 2013 Iowa soybean yield that was pegged at 46.0 bpa in the August report.
This graphic shows that every time August rainfall in Iowa was less than 50% of normal since 1980 the soybean yield was reduced from the September to the final report.
In fact, all seven times that Iowa precipitation has been less than two-thirds normal since 1080, only two years, 1983 and 1992 saw a yield increase from the September to final report.
1983 was a poor growing season that was complicated by the PIK program that season while 1992 yields were helped by the second coolest August in that states history.
A final note is the trend that fits most closely to this scatterplot is a polynomial one.
This reflects how August rainfall above 120% of normal actually contributes to falling yields, as extra rains can be detrimental to growth. Secondly, is the asymmetric response that soybean yields have to July-august precipitation as documented in a USDA paper we referenced earlier in the year.
Similar to the response of corn to July precipitation, soybean yield reductions due to lower July-August precipitation are larger than yield gains due to higher precipitation.
In other words, dry August weather has a much greater negative impact on soybean yields than normal to above August precipitation has a positive impact.
(KA)
Comments
To comment, please Log In or Join our Community .