

Fundamentally Speaking
Soybean Conditions, Deviations in Yield

Bulls and bears have much to argue about the current state of soybean conditions though the former seems to have had the upper hand over the past three weeks.
Much of this is due to the very dry August that recently has been augmented by the hottest temperatures of the season.
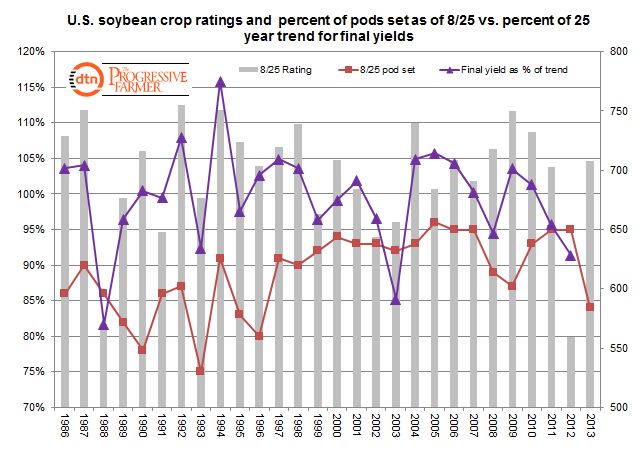
This graphic shows the U.S. soybean crop ratings and the percent of the nation’s crop setting pods as of August 25 from 1986 to 2013 while also tracking final yields as a percent of the 25-year trend.
P[L1] D[0x0] M[300x250] OOP[F] ADUNIT[] T[]
Using our usual ranking system where we weight the crop based on the percent in each category and assign that category a factor of 2 for VP, 4 for P, 6 for F, 8 for G, and 10 for EX and sum the results, this year August 25 rating was 708.
This is higher than the 5 to 25 year average for this time of year, ranging from 692 to 696.
The bulls would note however that readings have tumbled by 32 points since the beginning of July and are poised to fall below the recent end of August averages after very stressful weather the last week of the month.
They also point to the lagged state of crop development with the percent setting pods at 84%, the lowest figure for that that date since 1996.
The other five instances since 1986 where the percent of plants setting pods is less than 85% have had final yields average 97.7% of trend.
The other side is that with many plants still setting pods any late August or even September rains may be able to help stabilize or even improve yields.
Of course, that is dependent on precipitation patterns start to increase and of course reinforces the need for a later than normal first fall freeze in much of the Midwest.
(KA)
© Copyright 2013 DTN/The Progressive Farmer. All rights reserved.
Comments
To comment, please Log In or Join our Community .