

Fundamentally Speaking
Timing of Lows in Dec Corn
With the cool temperatures and decent rainfall, 2013 U.S. corn yield estimates are on the rise.
Talk is that the USDA may hike the 2013 corn number up from its current 156.5 bushel per acre (bpa) estimate when the first field based crop production report is released on August 12th.
Another pertinent question is when will the low be made?
We do not have answers to either of these questions for the jury is still out on how large the 2013 U.S. corn crop will be for that will have a bearing on the ultimate low and when that will occur.
P[L1] D[0x0] M[300x250] OOP[F] ADUNIT[] T[]
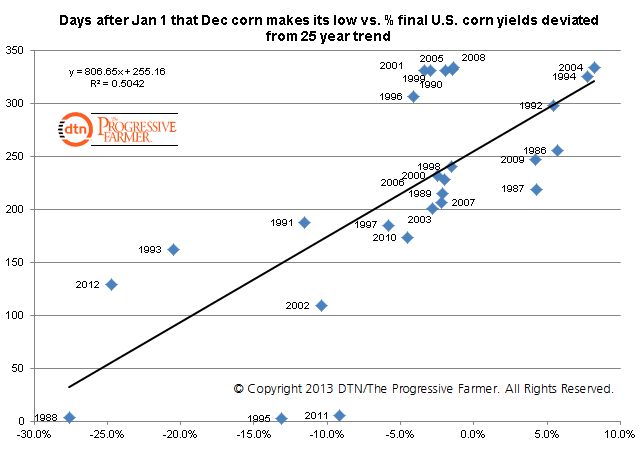
With regard to timing, the accompanying chart shows the scatter-plot relation between the percent that final corn yields deviated from trend and how many days after January 1 did the December corn futures of that year make its low.
The data shows an upward trending line indicating that the higher the yield is over trend the later in the year will December corn futures make its ultimate seasonal low and vice-versa.
It often takes a while for the market to comprehend just how sizable a large crop can be.
Another consideration is farmers selling of cash grain after all the storage bins are filled and that is most often seen at the tail end of harvest.
Conversely, short crops often have early peaks and long tails.
It appears that final yields as a percent of trend explains a little over 50% of when the low is made.
The equation of this line indicates that if yields come in at trend the low will be made 255 days after January 1 or by September 12.
Each percentage point above trend implies the low is made 8 days after that.
So for instance, if the 2013 corn yield comes in at 10% above trend the ultimate low should be made 335 days after January 1 or on December 1.
No surprise then that years when final U.S. corn yields were more than 10% above trend the ultimate low for December corn those seasons came well after 300 days past January 1 or after October 1.
(KA)
© Copyright 2013 DTN/The Progressive Farmer. All rights reserved.

Comments
To comment, please Log In or Join our Community .