

Fundamentally Speaking
Pasture Conditions May Provide Clues on Corn & Soybean Yields
The USDA has been reporting on U.S. pasture and range conditions since 1995.
Similar to the methodology we use for other crops, we rank pasture conditions where weighting the crop based on the percent in each category and assign that category a factor of 2 for VP, 4 for P, 6 for F, 8 for G, and 10 for EX.
These numbers translated into an initial pasture crop rating of 572 when the first conditions report were released back in the middle of April.
This is by far the lowest initial pasture crop rating since the numbers were first made available back in 1995 with the second lowest 620 back in April 1996.
This low ranking really should not be any surprise given the persistence of the worst U.S. drought since the 1950’s, especially in some of the major pasture and range producing regions in the country.
P[L1] D[0x0] M[300x250] OOP[F] ADUNIT[] T[]
Over the past two months, copious amounts of rain have improved the pasture conditions by a large degree with mid-June readings now at 660, a 15.4% increase in two months.
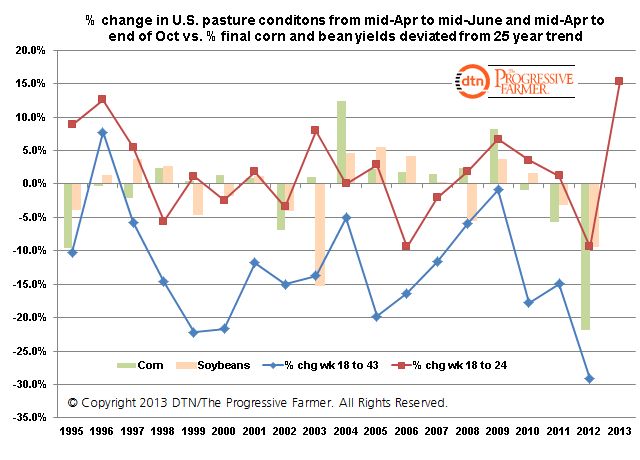
We were curious if changes in pasture conditions over two months and over the course of the season (mid-Apr to mid-Oct) provided any insights into how the U.S. corn and soybean crop would fare.
This graphic shows the percent change in U.S. conditions from mid-April to mid-June and then from mid-April to mid-October vs. the percent that final U.S. corn and soybean yields deviated from their 25 year trend.
Note that pasture conditions usually decline through the growing season, falling by an average of 12.7% from where they started the year.
This is due to the rising temperatures and diminished rainfall that usually occurs in the growing season, to the detriment of pasture conditions.
In fact, the only year since 1995 when this did not happen was in 1996 when they advanced by 7.7%.
In 2009, the seasonal decline was very low at 0.9% and we see that both 1996 and 2009 were slow planting years for corn with the percent in the ground as of May 15 at 56% and 58% respectively.
This was due to heavy spring rains that delayed timely corn seedings yet helped maintain pasture conditions all growing season.
A simple correlation coefficient shows a 48.3% relation between the change in pasture conditions through the growing season to the percent deviation for corn yields and a 32.9% relation for soybean yields.
We suspect the higher correlation with corn is linked to more corn area encompassing the U.S. land devoted to pasture as opposed to soybeans. In 1996 corn yields came in at trend while bean yields were 1.3% above trend while in 2009, record corn and soybean yields were produced.
We mentioned that the average seasonal decline in pasture conditions is 12.7% and years where the deterioration is less tend to have better corn averaging 1.7% above trend with no discernible impact on soybeans.
We would view this year’s dramatic improvement in pasture conditions over the past two months as being favorable, especially if this improvement is maintained.
(KA)

Comments
To comment, please Log In or Join our Community .