
Fundamentally Speaking
How do U.S. Corn Yields Fare the Year After a Poor Season?
For only the fourth time since 1866, U.S., corn yields have fallen three years in a row, the last time being 1928-30.
Given the actual harvested acreage from the three past seasons, based on trend yields the U.S. has lost close to 5.40 billion bushels worth of corn over the past three years combined.
Hence, it is only natural to expect some rebound in yields especially after the disastrous 2012 when U.S. corn yields averaged 123.4 bushels per acre (bpa), the lowest since 1995.
This is 20.8% below the estimated 1960-2012 trend, a level of performance only topped by a 25.0% decline vs. trend in 1988 and a 21.9% differential in 1983.
We were curious about corn yield performance after a particularly bad year, such as the one experienced a year ago.
P[L1] D[0x0] M[300x250] OOP[F] ADUNIT[] T[]
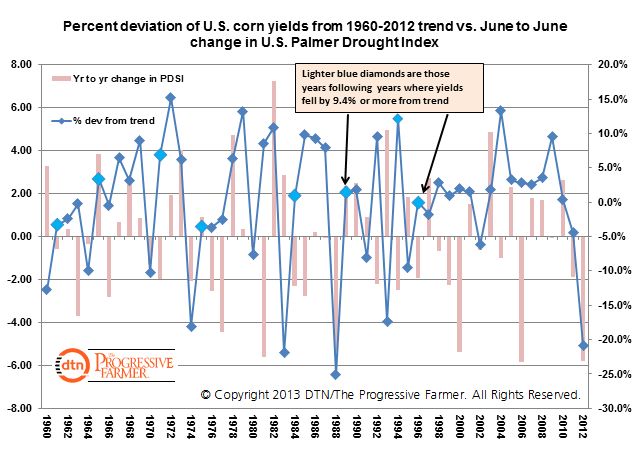
Bad years are defined as those years that saw final corn yields fall one standard deviation (-9.4%) below the 1960-2012 average that we calculate to be 0.0%.
Therefore, any bad year is where final yields fell by 9.4% or more below trend.
Besides the three years already mentioned other years include 1995 with yields off 9.5%, 1993 off 17.3%, 1974 off 18.1%, 1970 off 10.2%, 1964 off 10.0%, and 1960 off 12.8%.
Not including last year, there have been eight years where U.S. corn yields were 9.4% or more below the 1960-2012 trend.
The year after these bad years, final yields averaged 2.3% above trend ranging from up 12.2% in 1994 to a drop of 3.6% below trend in 1975.
Besides 1993 where poor yields were caused by floods, some of the bad years outlined above had drought conditions and we wondered whether an improvement in such conditions contributed to the rebound in yields.
For this, the change in the U.S. Palmer Drought Severity Index from the end of June to the end of the following June was measured.
Interestingly, the average change in the PDSI for these eight years was a drop of 0.28.
This implies that an improvement in drought conditions was not one of the main reasons why corn yields rebounded from the bad performance the year prior.
Using the 1960-2012 trend, the 2013 estimated trend yield for this year applied to that 2.3% average increase seen after poor years implies a U.S. corn yield of 161.1 bpa.
This is above the last USDA estimate of 158.0 and would be welcomed given the flooding rains this spring in much of the Midwest leading to a record slow corn planting pace.
(KA)
© Copyright 2013 DTN/The Progressive Farmer. All rights reserved.

Comments
To comment, please Log In or Join our Community .