

Fundamentally Speaking
2013-14 Matrix of U.S. Corn Ending Stocks

A lot of attention on USDA Ag Outlook sessions with expectations that the government will forecast record 2013 row crop production based on high planted acreage and a return to trend yields.
This should result in large ending stocks and the promise of much lower prices this fall.
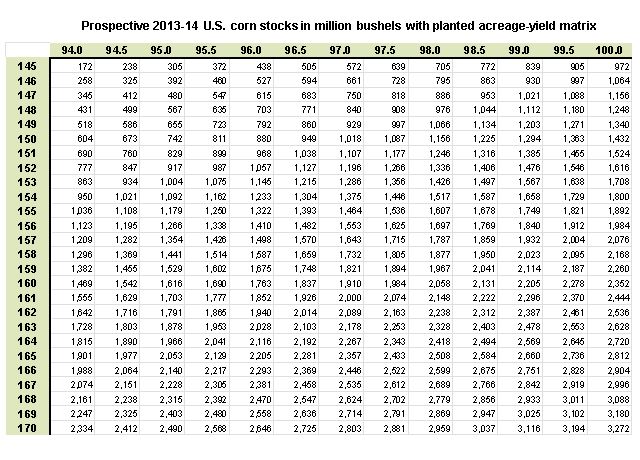
To get a sense of how large stocks could be we have prepared a matrix of prospective 2013-14 ending corn stocks in million bushels based on various combinations of planted acreage and yields per acre.
P[L1] D[0x0] M[300x250] OOP[F] ADUNIT[] T[]
There are certain assumptions we use including a beginning stocks of 632 million bushels based on the February 2013 WASDE report and estimated 2013-14 demand at 13.0 billion bushels.
We also use a 92% harvested to planted ratio. As an example, looking at the planted acreage figures going across the x-axis and the yields going down the y-axis has a figure of 1.910 billion bushels at the intersection of 97.0 million acres and 160 bushels per acre.
This is arrived at by taking 97.0 million times 92% times 160 bushels per acre that results in a production figure of 14.278 billion bushels.
To that, we add beginning stocks of 632 million and then subtract our estimated 2013-14 demand of 13.0 billion bushels resulting in a figure of 1.910 billion bushels.
Many in the trade feel that given the unlikelihood of having a fourth year in a row of poor weather, a sizeable build in ending stocks is reasonable.
Actually, a more bearish scenario can be seen if one thinks that the beginning stocks figure of 632 million will only increase in ensuing months given the poor demand seen this season, especially in the ethanol and export sectors.
Furthermore, assuming next year’s demand will rebound to 13/0 billion, a 16% jump over the 2012-13 figure may be a stretch.
(KA)
Comments
To comment, please Log In or Join our Community .