

Fundamentally Speaking
History of USDA Ag Outlook Forum Yield Estimates
After a positive reaction following the bullishly construed USDA reports issued on January 11, the grain and oilseed contracts have settled into wide trading ranges awaiting new fundamental inputs.
We suspect that South American weather will have the most impact as the Argentine and Brazilian corn and soybean crops move closer to their critical developmental periods.
P[L1] D[0x0] M[300x250] OOP[F] ADUNIT[] T[]
There will also be updated supply-demand information released on February 8, though the USDA numbers that will attract even greater interest are the initial 2013-14 balance sheets for the major crops that will be provided at their annual Agricultural Outlook Forum February 21-22.
In light of the adverse growing weather seen in recent years there has been quite a bit of interest as to where government forecasters will peg the estimated 2013 yields, especially for corn and soybeans.
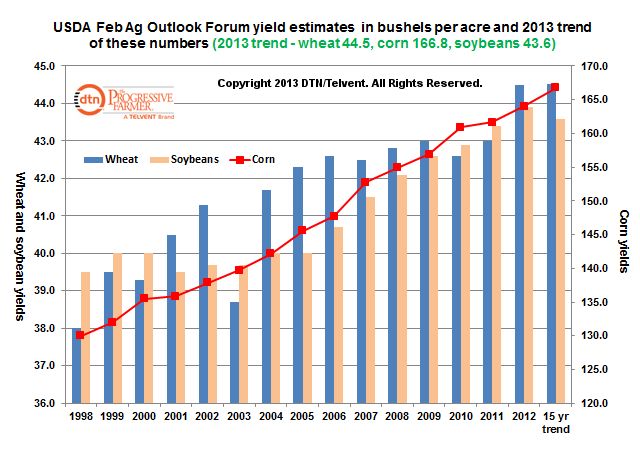
The accompanying graphic shows the projected yields from 1998 to 2012 for wheat, corn, and soybeans and based on this 15 year history, a calculated 2013 trend yield is provided.
Looking at the numbers shows that the USDA usually goes for some sort of trend yield and as consequence, each year provides a new record high yield estimate relative to their past predictions.
Based on the 1998-2012 numbers, a 15 year trend works out to a 44.4 bushel per acre (bpa) yield for wheat, 166.8 for corn, and 43.6 for soybeans.
The wheat figure may strike some as high given the ongoing drought problems with the hard red winter wheat crop but compared to the 2012 yield of 46.3bpa this looks reasonable.
The 43.6 bpa estimate for soybeans is almost exactly what has been seen on other prospective 2013-14 balance sheets.
The corn figure however at 166.8 bpa, a new record high if achieved looks very optimistic given that the 15 year trend using actual yields comes in at 152.0 bushels per acre.
(KA)

Comments
To comment, please Log In or Join our Community .