

Fundamentally Speaking
July Weather Factors vs. Corn Yields for Illinois
Next month the USDA will issue the annual crop production report including the final 2012 U.S. corn and soybean production.
Needless to say, the past growing season as one of the most stressful on record due to an intense drought that brought searing temperatures and little to no rainfall.
The month of July was particularly brutal with the lower 48 having the highest July temperatures since records were kept back in 1895.
With corn seen as a crop of July the high heat and limited rain has resulted in very poor yields this year.
P[L1] D[0x0] M[300x250] OOP[F] ADUNIT[] T[]
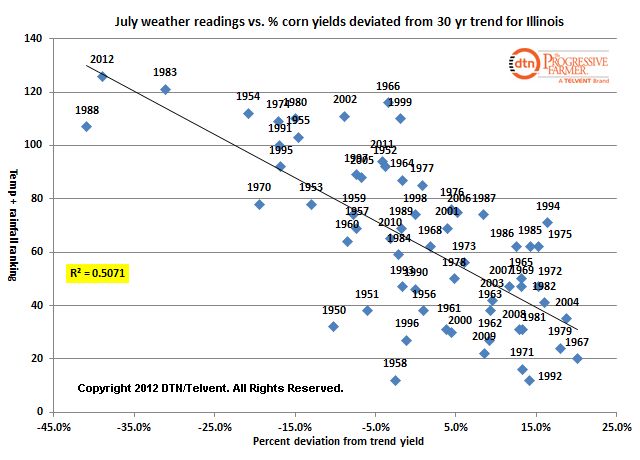
To illustrate the relation between July weather conditions and corn yields we present a scatter plot of ranked July temperature and precipitation combinations vs. the percent deviation from the 30 year trend for Illinois.
July temperature and precipitation data were collected and ranked for the 63 years between 1950 and 2012.
For temperatures, the coolest year was ranked 1, the second coolest number 2 and so on until the hottest year which is ranked 63.
For precipitation, the wettest year was ranked number 1, the second wettest number 2, and the driest year from 1950-2012 ranked number 63.
The rankings for each year were combined and plotted vs. the percent deviation from the 30 year trend.
If there was a year that had both the lowest July temperature and the highest July rainfall it conceivably has a ranking of 2 but no such year exists.
The closest was 1992 with a very cool average July temperature of 73.3 degrees and a hefty 7.25 inches of rain.
The worst combination would merit a ranking of 126 when both temperatures were warmest and rainfall the least.
Incredibly, there is such a year since 1950 when Illinois had is highest July temperatures and least amount of rainfall and that was this past July.
No real surprise then that in 1992, Illinois corn yields were a very high 14.2% above trend while this year’s Illinois corn yield is coming in 39.0% below trend, trailing only the 1988 40.9% shortfall from trend.
Regression statistics indicate that July temperatures and precipitation explain over 50% of the yield variability seen over the years in Illinois.
Note how poor yielding seasons such as 2012, 1988, and 1983 are off in their own little world with the better years also bunched together.
(KA)

Comments
To comment, please Log In or Join our Community .