

Fundamentally Speaking
12/1 Old-New Crop Dec Corn Spread vs. 2nd Half Demand
There has been heavy selling in corn and wheat over the past week where despite talk of an imminent surge in overseas business this has not happened.
The situation is particularly acute in corn where the sales pace is so lackluster that it may not allow total commitments to even attain a USDA projection the lowest since the 1971-72 season.
In addition to an abysmal export pace, the weekly ethanol grind is also running below USDA projections given poor margins while feed demand is pegged at the lowest level since 1988-89, off a whopping 32.5% from its peak level eight years ago.
With prices so high importers are seeking cheaper origin corn with Brazil undercutting the U.S., on a sale last week to Taiwan by 75 cents per bushel.
P[L1] D[0x0] M[300x250] OOP[F] ADUNIT[] T[]
Uncovered end-users are just barely buying hand to mouth, reluctant to extend coverage when prices remain at record highs for this time of year.
Buyers are hoping that cheaper prices will arrive in a few months when South America starts harvesting and certainly next fall on the heels of what is hoped to be a record U.S. crop.
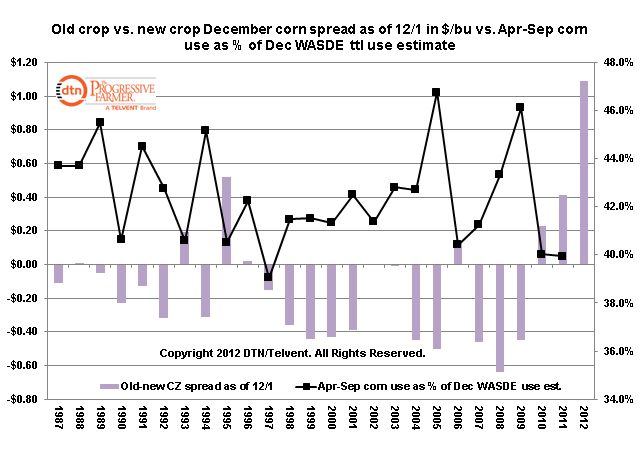
The accompanying chart illustrates this by plotting the spread between old crop December and new crop December as of December 1st.
This year the spread was a record wide $1.09 per bushel or Dec 2012 that amount over the Dec 2013 contract.
This is the third straight year that old crop has been premium to new crop and the graph does indicate this price inversion does appear to have a negative impact on total demand for the second half of the marketing year (Apr-Sep).
The chart plots the old-new crop price spread as of December 1st vs. total U.S. corn usage from Apr-Sep as a percent of the December WASDE total use figure.
Over the past two years, high corn prices has resulted in total use for the second half of the marketing year at 40% of the December WASDE figure which except for 1997 is the lowest in the past 25 year implying that high nearby as opposed to cheaper deferred prices does have a depressing impact on demand.
With the December WASDE figure unchanged from what was given last month at 11.167 billion bushels, this means Apr-Sep demand at 40% would be 4.467 billion bushels.
Thus would result in demand for the first half of the year at 6.70 billion bushels or 10% below the year ago figure though we suspect the decline vs. the year ago level will be much higher given what we have already mentioned.
(KA)
© Copyright 2012 DTN/The Progressive Farmer. All rights reserved.

Comments
To comment, please Log In or Join our Community .