

Fundamentally Speaking
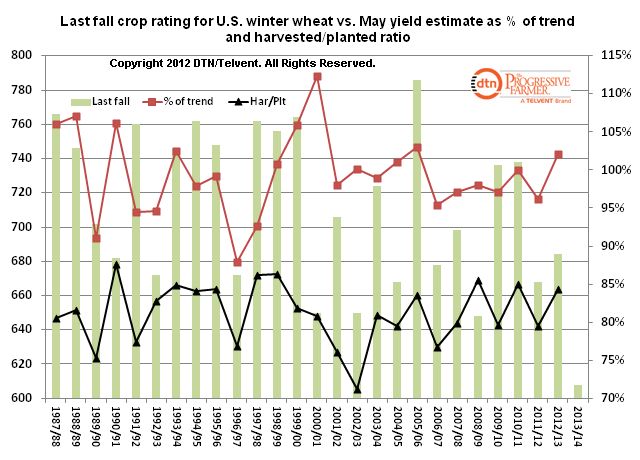
Fall Winter Wheat Ratings vs. Yields & Harvested/Planted Acreage Ratio

The final fall U.S. winter wheat crop ratings were released and as expected they are the worst since the USDA started keeping records back in 1986.
Using our usual ratings system where we weight the crop based on the percent in each category and assign that category a factor of 2 for VP, 4 for P, 6 for F, 8 for G, and 10 for EX and then sum the results, this year’s last rating was 608.
P[L1] D[0x0] M[300x250] OOP[F] ADUNIT[] T[]
Though it is often said that there is little relation between fall crop conditions and their impact on yields, we were interested in what affect it would have on the May yield estimate, the first of the year, and the harvested to planted acreage ratio.
A simple correlation coefficient does indicated a very weak 10.6% figure though the correlation between the last fall crop rating and the harvested to planted ratio is three times that level.
For the 26 observations, we looked for particularly bad years, which we classified as the average less one standard deviation resulting in a crop condition rating of 671 or lower.
We found five such years but interestingly, the average yield for those five years was 102% of trend while the harvested to planted ratio was 79.3% vs. the average ratio for all years of 81.3%.
The worst end of all crop rating prior to 2012 was in 2008 at 648 with the yield that year 98.1% of trend yet the harvested to planted ratio was a very high 85.5%.
There are years when high fall ratings resulted in well below trend yields suggesting that weather conditions when the crop comes out of dormancy are more important.
Nonetheless, with the worst ratings ever and continued drought conditions in the Plains, we feel the 2013 U.S. winter wheat crop is well behind the eight ball.
(KA)
Comments
To comment, please Log In or Join our Community .